Investment themes

Megatrends

Investment themes

Sustainable Development Goals

Portfolio

Impact

Megatrends

Resource scarcity

Population growth

Energy transition
& climate change

Investment themes

Ecology - Recycling - recycling-refresh@2x

Resource Efficiency

Sustainable Development Goals
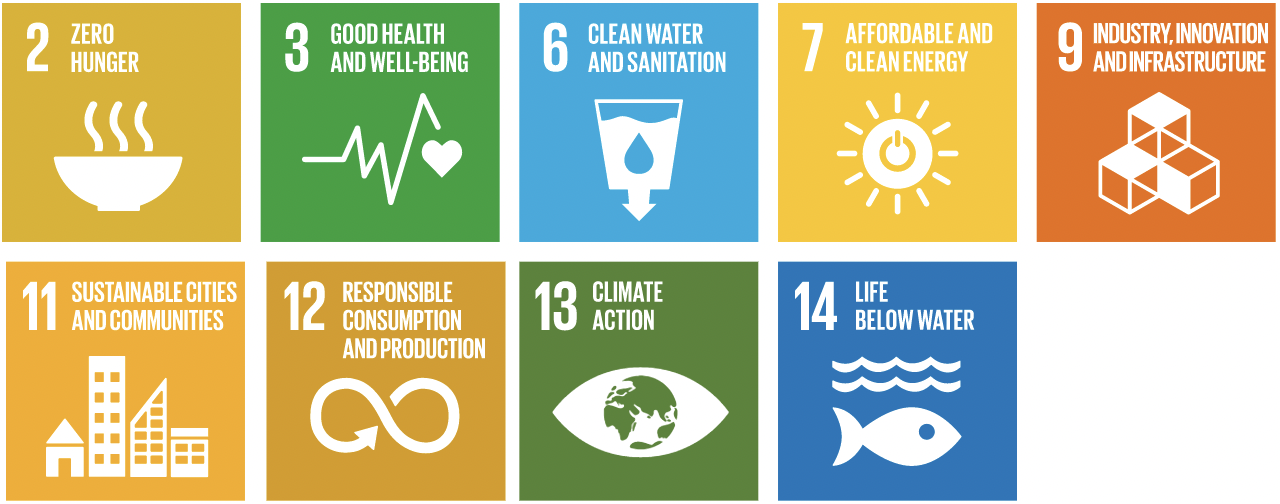
SDG_icons_collect1@2x
Screenshot 2021-06-15 at 11.56.28

Portfolio

Milarex@2x
Kiona logo@2x
LakersLogo@2x
SorteraLogo@2x
NG_Logo@2x

Impact

Leaf_icon@2x

Environmental

Megatrends

Ageing demographics

Global population growth

Investment themes

Family-Babies-Kids - Family - family-home@2x

Changing Demographics

Sustainable Development Goals

SDG_icons_collect2@2x
Screenshot 2021-06-15 at 11.56.39

Portfolio

Hytest_logo@2x
Logex@2x
Olink@2x
SynergenicsLogo@2x

Impact

Group_chat_icon@2x

Social

Megatrends

Technology disruption

Energy transition

Global populations growth

Investment themes

Internet-Networks-Servers - Cloud - cloud-download@2x

Tech-Enabled Business

Sustainable Development Goals

SDG_icons_collect3@2x
Screenshot 2021-06-15 at 11.56.51

Portfolio

Infobric@2x
ecoonline@2x
documaster@2x
Pagero@2x

Impact

GovernaceIcon@2x

Governance

SDG scorecard & dimensions of impact

Scorecard Elements

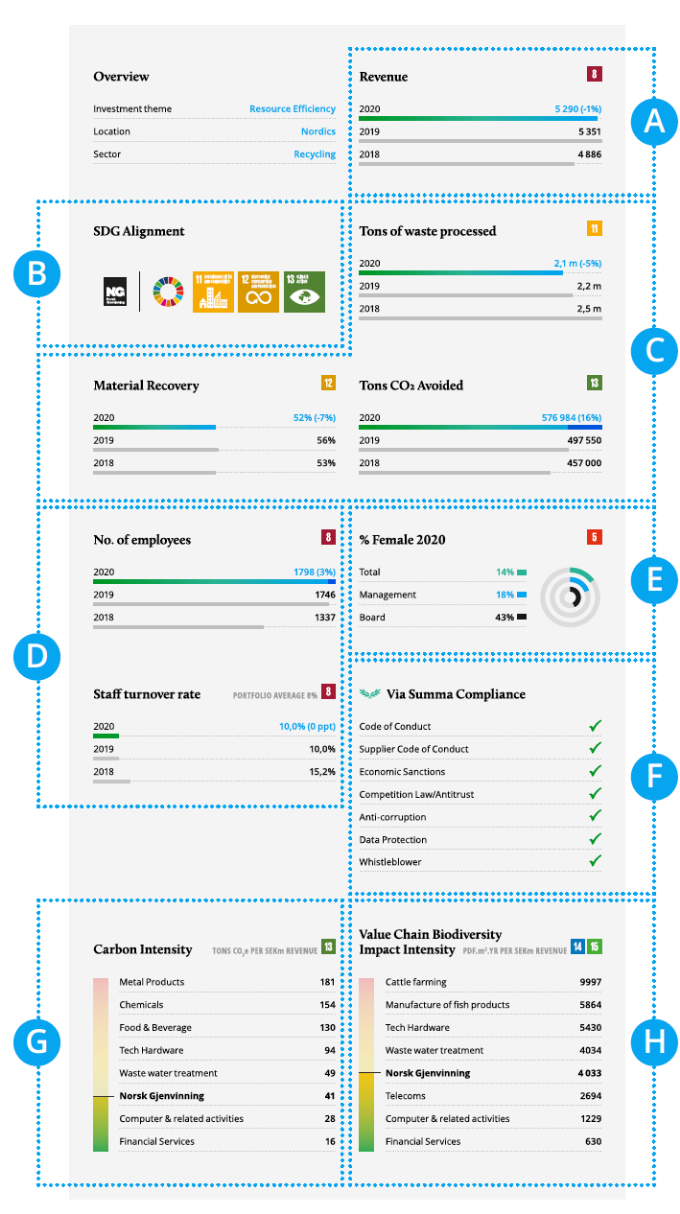
The Summa SDG scorecard is intended to provide quantitative insights into the positive outcomes provided by our portfolio companies as well as transparency on potential negative outcomes.
scorecard_info@2x
A@2x

Financial performance

B@2x

Main strategic SDGs

C@2x

Value Creation SDG KPIs

These KPIs on row two are indicators of positive outcomes. Since these may be unique to each business model, the row contains different metrics for each company.¹

D@2x

Organizational health and sustainable growth

The number of employees by year shows how many jobs the company provides, and adds perspective to how this has developed over time.

The staff turnover rate is a related to organizational health and employee engagement. It can be affected by factors like the quality of management, diversity issues and job satisfaction.

E@2x

Diversity

The concentric circles show gender balance across the general, management and board levels of the organization.²

E@2x

Via Summa Compliance

This shows the integration status of the various elements of Via Summa Compliance. The requirement is that the company should have established a fit for purpose procedure for ongoing risk management of the listed topics.

G@2x

Carbon intensity

The scale on the left shows the company’s climate impact in relation to its top line revenue. For the purposes of this report, we use all available data to get the best estimate we can, adding up emissions from Scopes 1-3 to calculate intensity. To give some context to the magnitude of this impact, we are benchmarking against a range of broad industry categories from financial services to metal work.3 Progress may be achieved through a material decrease in carbon intensity over time.

H@2x

Ecological degradation Intensity

The scale on the right hand side of the scorecard indicates the company’s impact on ecosystems and biodiversity, in relation to its revenues. The scale is used to provide context, and benchmarks the impact against a range of broad sector categories. We encourage our portfolio companies to consider their impact on biodiversity and if possible engage in dialogue with their suppliers to reduce this externality over time.

Impact dimensions⁴

At Summa we wish to continually deepen our understanding of impact, improve our management of portfolio value creation and increase the clarity in our communication of outcomes generated by our portfolio companies.

This is the background for the new layout of page two in the following company presentations, where we have broken down the qualitative description of the company impacts into five paragraphs linked to the five dimensions defined by IMP4,5:

Square_icon@2x

What tells us what outcomes the enterprise is contributing to and how important the outcomes are to stakeholders.

Circle_icon@2x

Who tells us which stakeholders are experiencing the outcome and how underserved they were prior to the enterprise’s effect.

Layer_icon@2x

How much tells us how many stakeholders experienced the outcome, what degree of change they experienced, and how long they experienced the outcome for.

Plus_icon@2x

Contribution tells us whether an enterprise’s and/or investor’s efforts resulted in outcomes that were likely better than what would have occurred otherwise.

Triangle_icon@2x

Risk tells us the likelihood that impact will be different than expected.

  1. Depending on availability we use either operational output metrics or estimations of stakeholder outcomes as proxies for impact.
  2. Although this shows only one dimension of diversity directly, it may also be seen as a distant proxy for diversity in a broader sense. For the “management” cateogry we ask that our portfolio companies include Women at all levels; junior, mid-level and senior leadership positions.
  3. The scale is calibrated to enable a comparison of the companies in our particular portfolio, and the cutoff on the high end may therefore seem somewhat arbitrary. However, if we were to include sectors like power generation or agriculture on the scale, it would make most of our company impacts seem of little significance, which is not the view we wish to present.
  4. Please see https://impactmanagementproject.com/ for more information on the five impact dimensions
  5. Impact Management Project