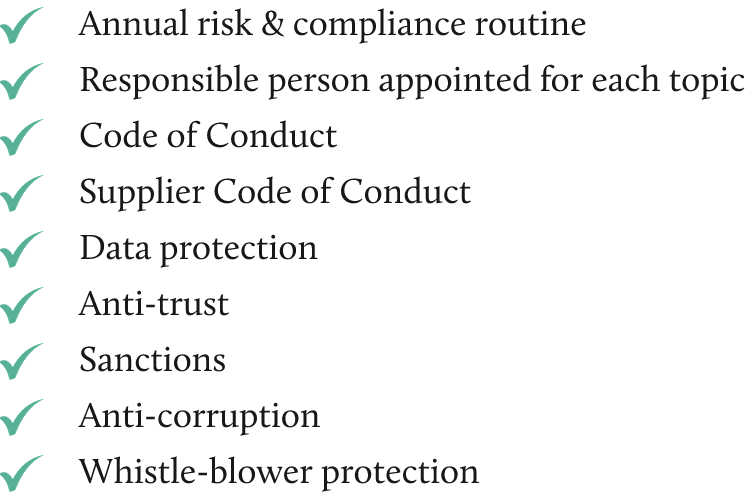
Via Summa Compliance:
A framework to aid good corporate governance
Our approach to value preservation
Summa takes an active approach to ownership, by partnering with our portfolio companies on their growth journey. As owners our vision is to co-create the winning companies of the future economy, by delivering sustainable financial outperformance alongside magnified positive impact.
Via Summa Compliance was developed as a framework and tool kit for our portfolio companies to tackle key global governance issues through strong policies and risk management procedures.
It also helps us monitor and ensure that adequate compliance mechanisms are in place with regard to the 10 principles of the UN Global Compact.
A risk & materiality-based approach
Via Summa Compliance is not a “one-size-fits-all” box ticking exercise but is a risk- and materiality-based approach.
While it is important that all our companies implement adequate management procedures for each policy area, the specifics may be modified to each individual case. High-risk areas may require more frequent reviews, more elaborate procedures or more resources. Low-risk areas may be adequately managed under a lighter regime.
Compliance is an on-going process
The key to compliance success is how you operationalize your framework. Putting adequate written routines and guidelines in place only brings you one step of the way. Even more important are periodic risk reviews, regular staff trainings, facilitating organizational change as well as setting and following up on goals and targets. Compliance is an on-going process that requires solid governance mechanisms, as well as adequate resources.
Risk management and policy areas
Portfolio social impact
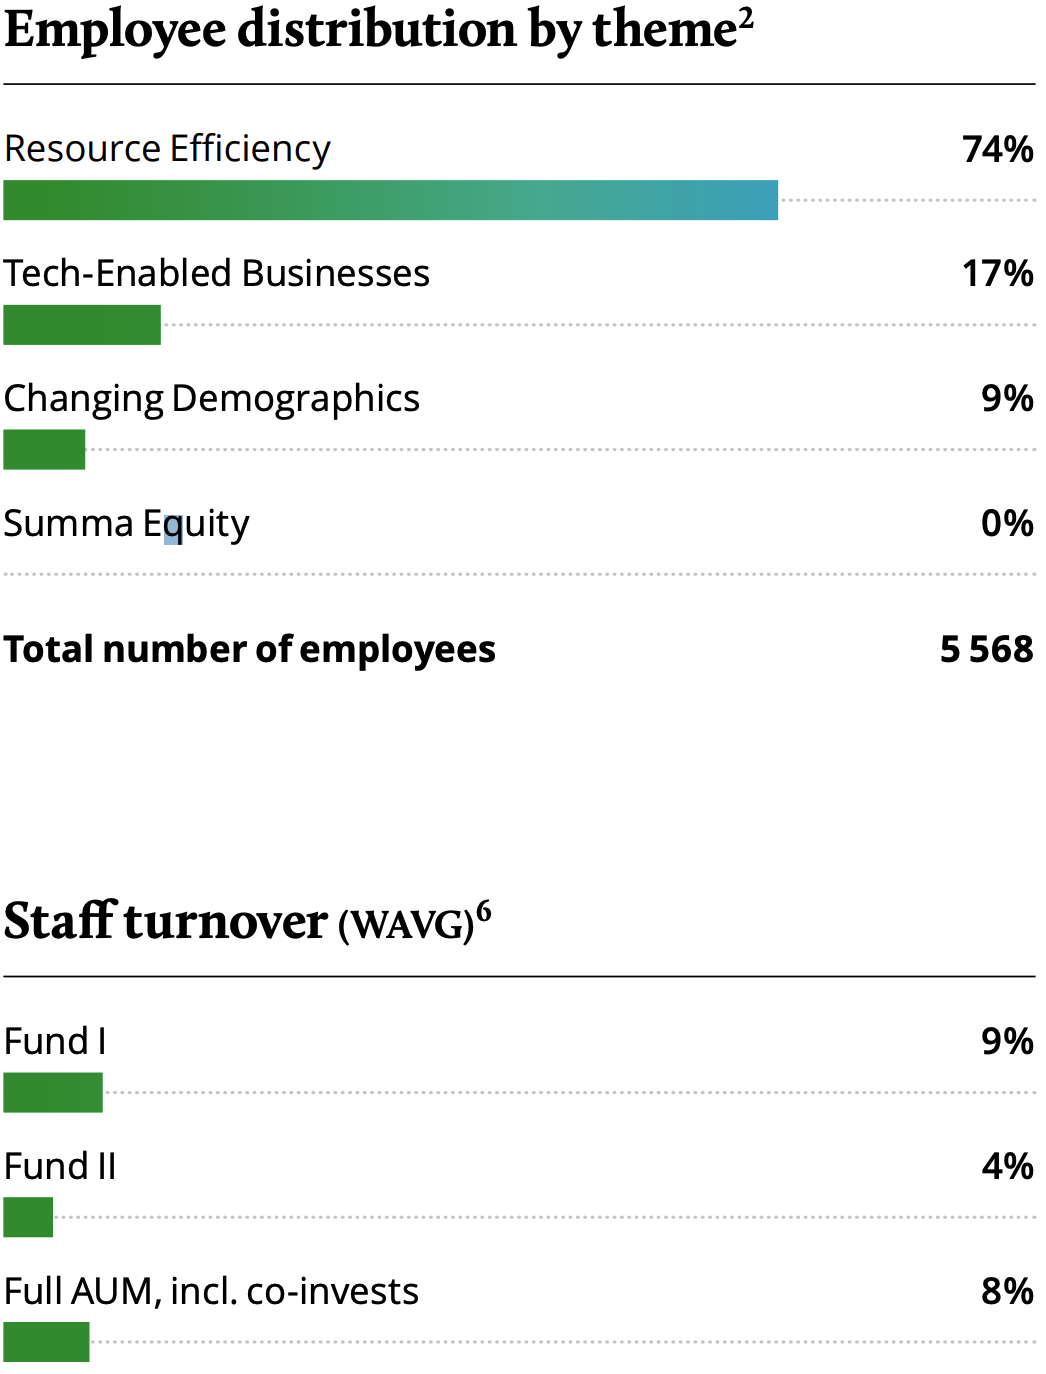
Summa believes it is important to assess and report on the social as well as the environmental impact of our portfolio companies. A portfolio wide focus area is diversity and inclusion, where we closely track gender statistics in particular.
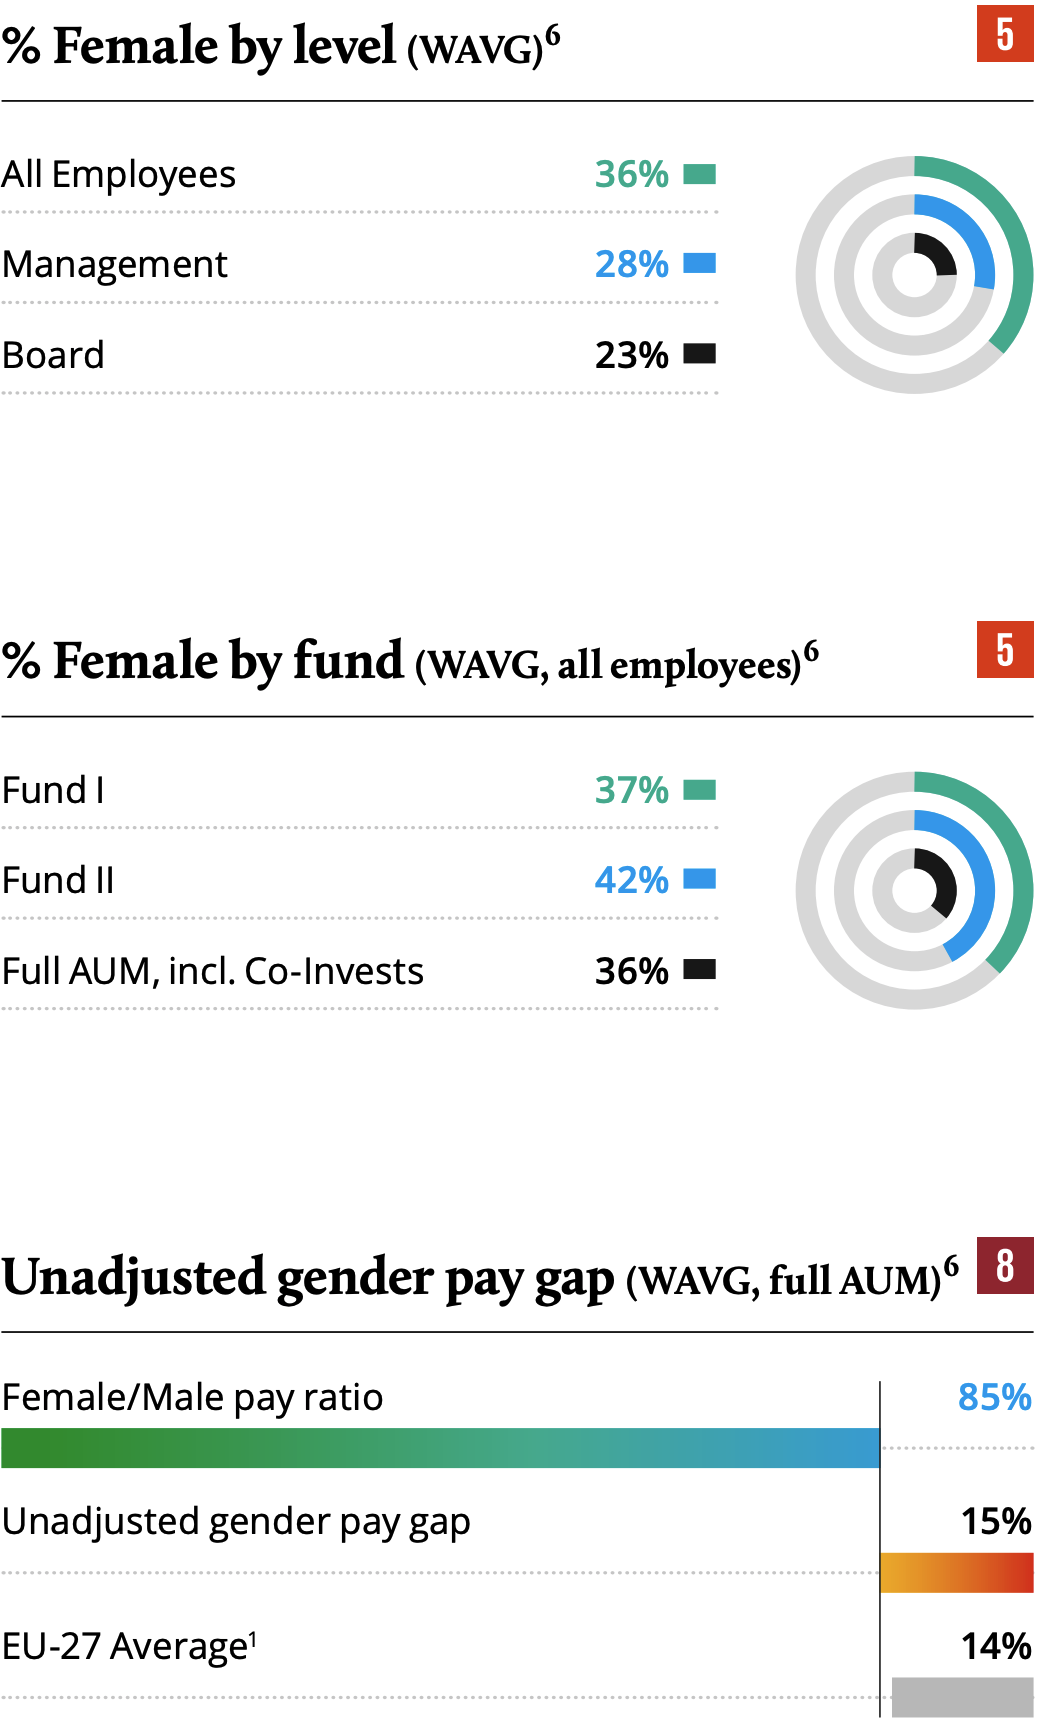
Gender parity is important in its own right, and we also believe in the value of having diverse perspectives represented at all organizational levels. While diversity is multifaceted, and dimensions other than gender diversity are also important, the gender based diversity statistics serve as a useful starting point for stakeholder engagement on these issues.
In 2019 we set targets to increase gender diversity in portfolio company boards. Targeting at least one female member of each board by the end of 2020, we fell slightly short with two boards still lacking female representation. Despite this, the weighted average representation has increased from 14% to 23%. Our ongoing target is at least 40% representation.
In 2020 we gathered data on unadjusted gender pay gaps in the portfolio for the first time to assess equality in addition to diversity1. This metric simply compares the average wage for all females in an organization, with the average for all males, regardless of position. While the unadjusted gender pay gap1 is not a measure of “equal pay for equal work”, it can be useful for addressing a broader set of issues as it also picks up the financial effect of fewer women being in senior positions, among other factors.
We are encouraging our portfolio companies to also monitor and report on wage disparities in each employment category, as this will yield more accurate insights that will enable them to work actively with these issues.
- https://ec.europa.eu/eurostat/statistics-explained/ index.php?title=Gender_pay_gap_statistics#Gender_ pay_gap_levels_vary_significantly_across_EU
- Not weighted by ownership share, excl. Olink
- Work related fatality means a death occurring while a person is at work, or performing work related tasks
- Average of companies with material incident rates; Norsk Gjenvinning, Sortera and Milarex, weighted by Summa's equity value. Refers to incidents causing at least one absentee date.
- https://www.hms.norskindustri.no/ skade_rapport.cfm?rapportID=4
- ‘weighted average’ means a ratio of the weight of the investment by Summa in an investee company in relation to all investments of Summa; weight has been determined by using current (fair) value as of Q4 2020. Companies for which ESG data could not be obtained have been excluded (e.g. Olink)
Health and safety
- https://ec.europa.eu/eurostat/statistics-explained/ index.php?title=Gender_pay_gap_statistics#Gender_ pay_gap_levels_vary_significantly_across_EU
- Not weighted by ownership share, excl. Olink
- Work related fatality means a death occurring while a person is at work, or performing work related tasks
- Average of companies with material incident rates; Norsk Gjenvinning, Sortera and Milarex, weighted by Summa's equity value. Refers to incidents causing at least one absentee date.
- https://www.hms.norskindustri.no/ skade_rapport.cfm?rapportID=4
- ‘weighted average’ means a ratio of the weight of the investment by Summa in an investee company in relation to all investments of Summa; weight has been determined by using current (fair) value as of Q4 2020. Companies for which ESG data could not be obtained have been excluded (e.g. Olink)
Social & governance impact highlights


Portfolio negative climate impact
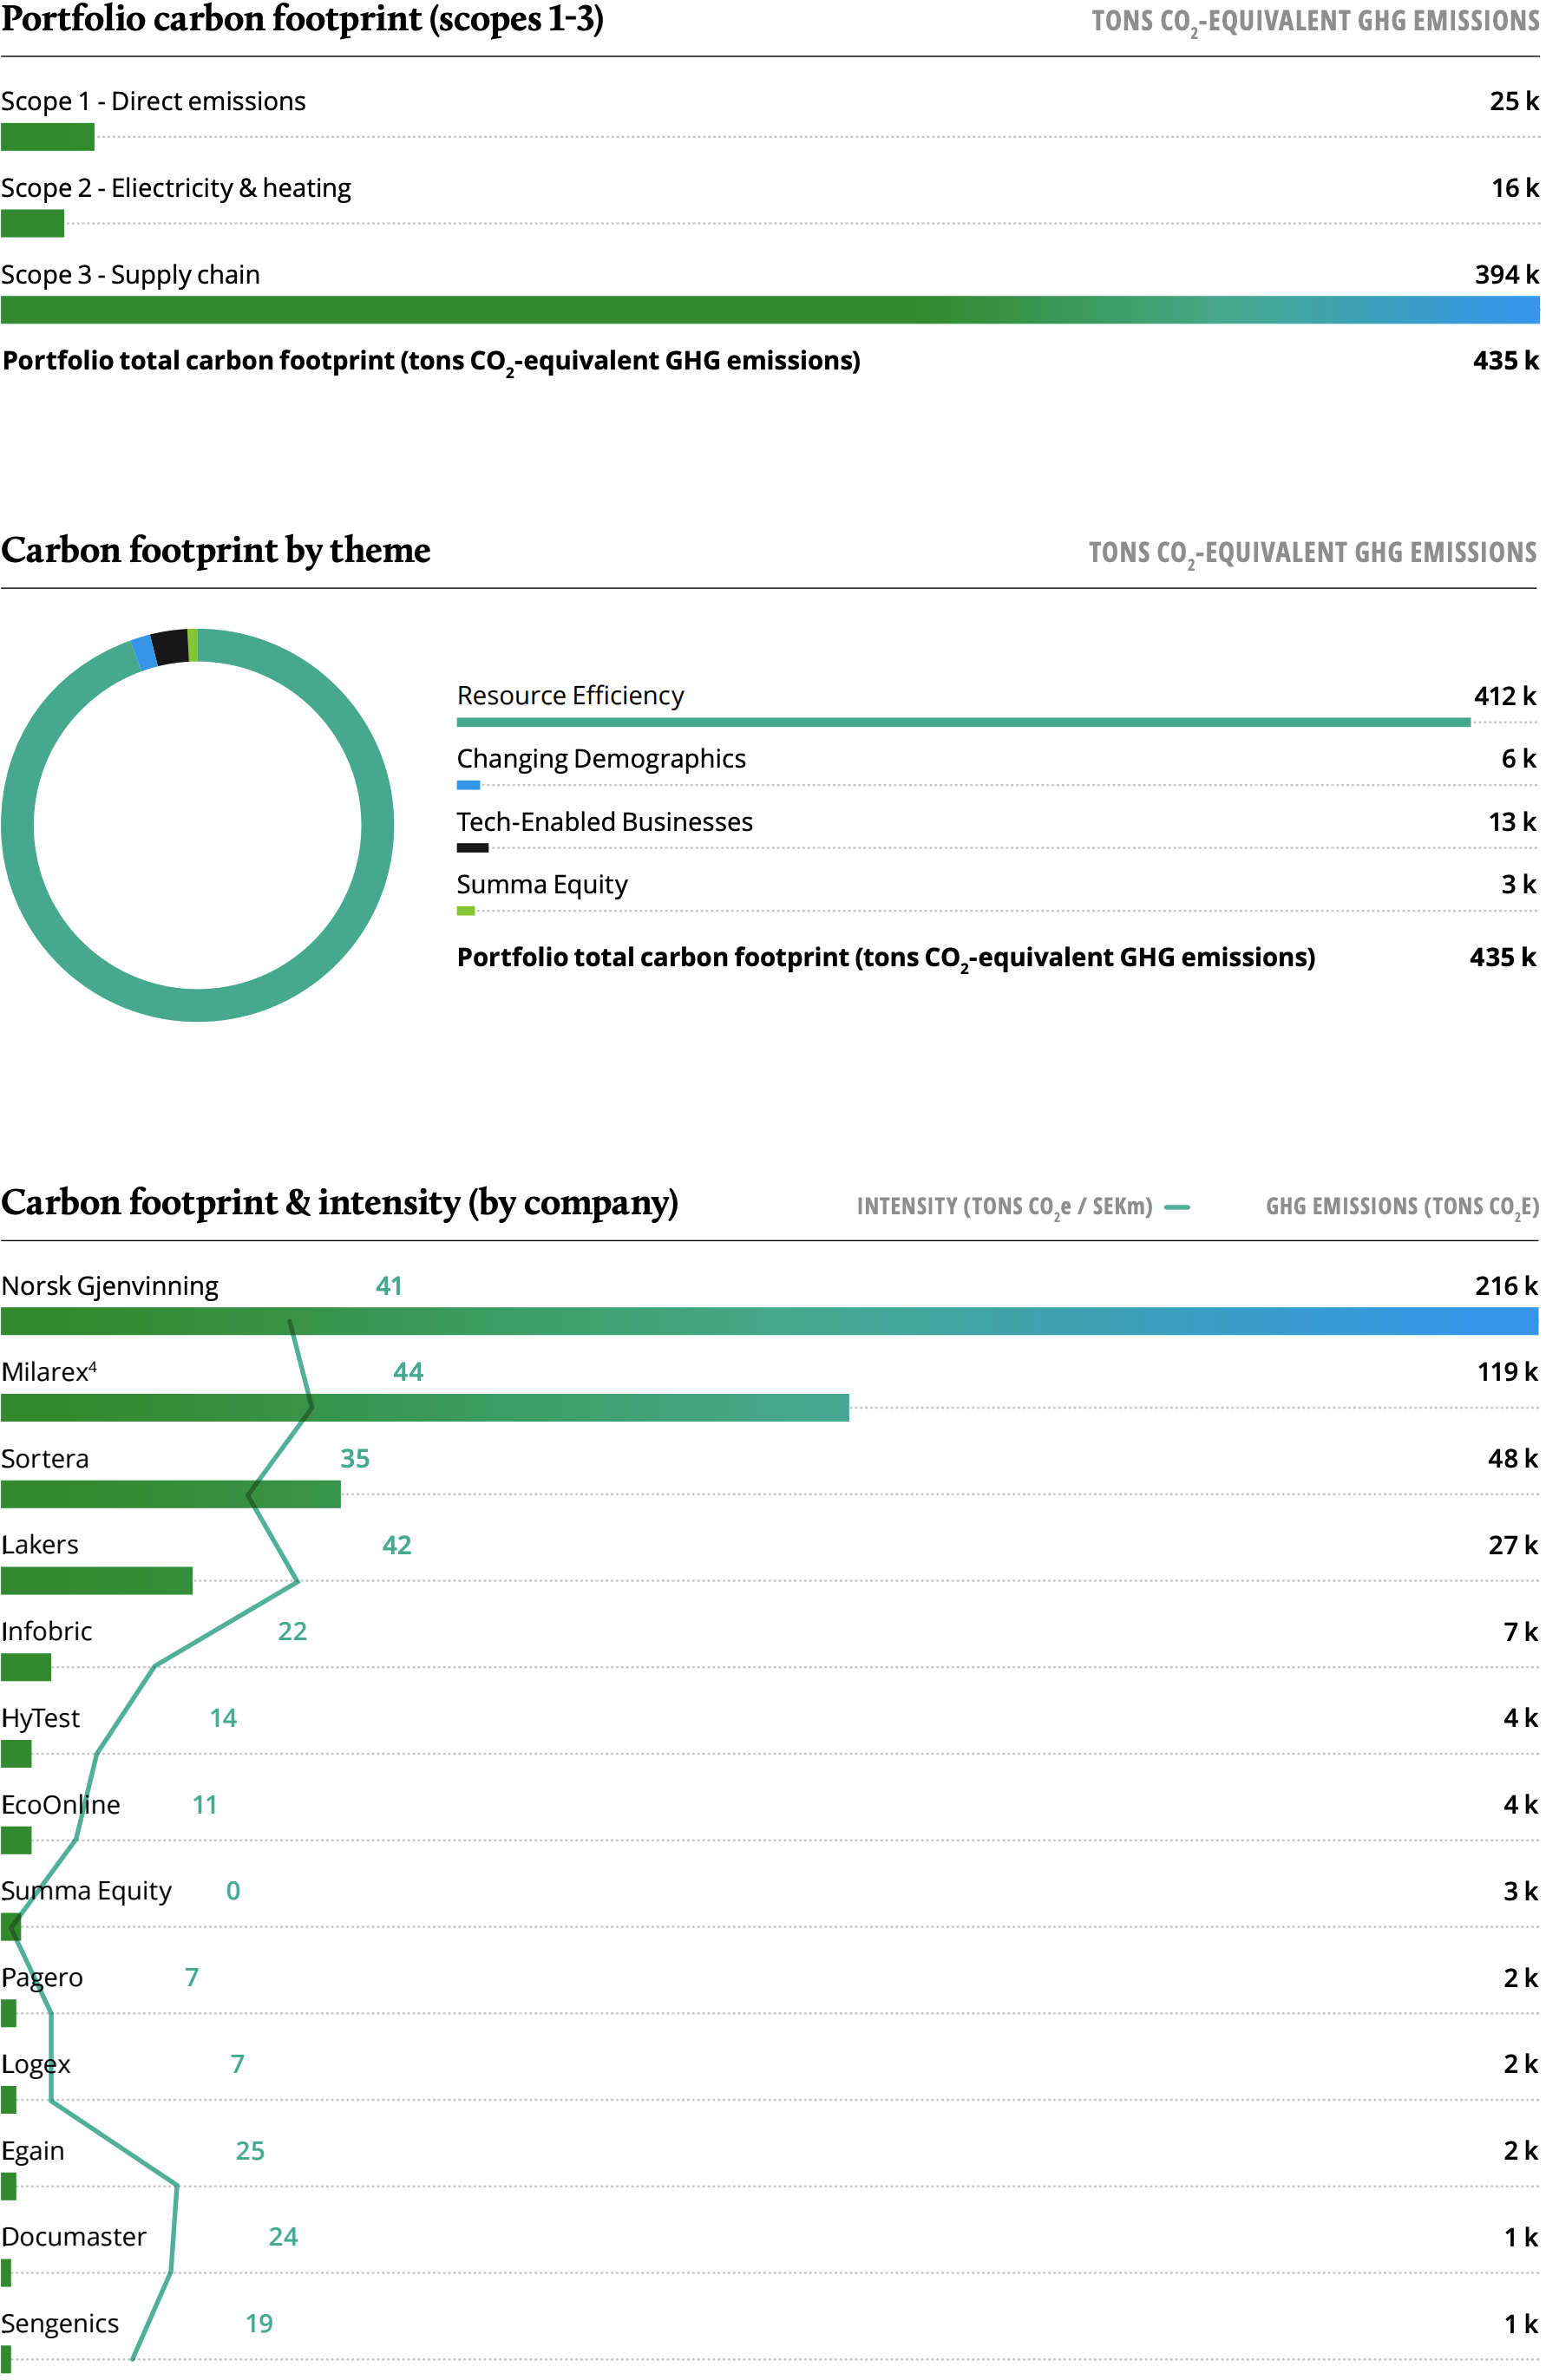
In total, Summa’s portfolio caused approximately 435k tons of CO2- equivalent (CO2e) greenhouse gas (GHG) emissions1 in 2020, of which 25k tons were direct emissions (Scope 1) and 16k tons came from electricity and heating (Scope 2). The rest consists of indirect emissions occurring in the portfolio company supply chains (Scope 3)2. Norsk Gjenvinning has implemented new procedures to improve tracking of Scope 3 emissions, and as a result show higher emissions this year. This is a result of the more extensive analysis. Data for Olink could not be gathered and disclosed this year due to the recent IPO, the company is therefore excluded from portfolio totals.
It is Summa’s ambition that our portfolio should support a transition to a low carbon economy, and we will target reductions to align with a 1.5°C scenario. In our view, we can make a meaningful contribution by reducing the intensity of emissions by 50% from the baseline between 2020 and 2030, or about 7% each year3. We actively engage with our portfolio companies, discussing their emissions and potential mitigation avenues. Several of our companies are taking concrete steps like adopting more renewable fuels, or actively selecting suppliers based on their sustainability credentials.
- Greenhouse gases (GHG) are a collection of six gases that have an impact on the earth’s climate change. Emissions are considered within three Scopes as follows; Scope 1: Fuel combustion, company vehicles and fugitive emissions, Scope 2: Consumption of purchased electricity, heat or steam. Scope 3: Purchased goods, materials and services, transport activities etc. GHG emissions are measured in tons of CO2 equivalents.
- Normative performs this analysis using data on supplier spending for each company, as well as data on fuel and energy use. See https://normative.io/en/ for more information.
- Summa focuses on improvements in terms of intensity over time, as rapid business expansion will otherwise obscure improvements that are made to increase efficiency. Absolute figures for a particular company may increase year-on-year due to the high targeted revenue and sales growth. Focusing on absolute figures may also be problematic due to exits from large emitters having a large effect on the portfolio total and average.
- Milarex’ emissions from sourced raw materials are now based on volumes rather than cost. The remaining supply chain emissions are based on the amount spent. The emission factors have not been adjusted to account for the sustainability certificates of Milarex’ raw materials.
Potential positive climate impact
Several of our companies in the Resource Efficiency theme have a potential CO2e avoidance effect through the waste management or energy optimization services that they provide. This accounted for about 701k tons CO2equivalents in 2020.


equivalent to...

equivalent to...
road for one year


equivalent to...
- See Basecamp Explorer’s Sustainability Report for additional information https://www.basecampexplorer. com//data/wordpress/htdocs/wp-content/uploads/2020/04/basecamp-explorer-sustainability-report-2019-15-4-20.pdf. Summa Equity supports the project on a voluntary basis. The CO2 offsets associated with this project are not certified by any entity. On average, it takes about 20 years before the trees are fully grown.
Portfolio revenues and
climate externalities

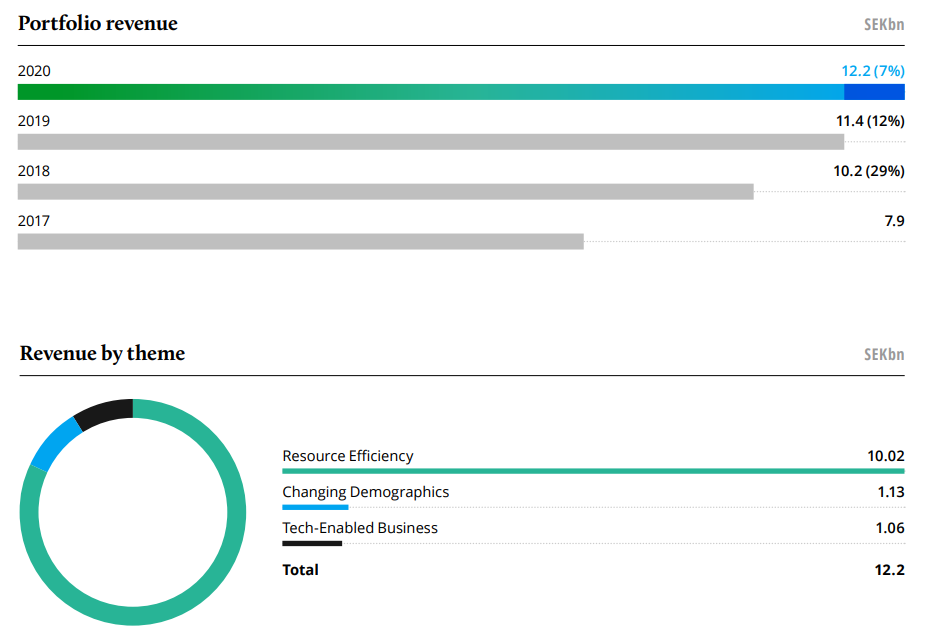
Summa’s portfolio achieved a revenue growth of 7% from 2019 to 2020, pro-forma adjusted for add-ons where relevant and feasible.
In total, Summa’s current portfolio revenues were SEK 12.2 bn in 2020, not weighted by Summa’s share of ownership.
Monetized externalities: Impact weighted accounts (IWA) pilot
Summa recently conducted a pilot with the Impact-Weighted Accounts Project at Harvard Business School. In this initial trial we looked at societal costs along the environmental pillar, using CO2- equivalent greenhouse gas emissions as the input. The IWA methodology enables a cost-analysis by affixing a price to a
range of clearly defined harmful effects to nature and human health associated with these emissions.
The societal cost of climate change
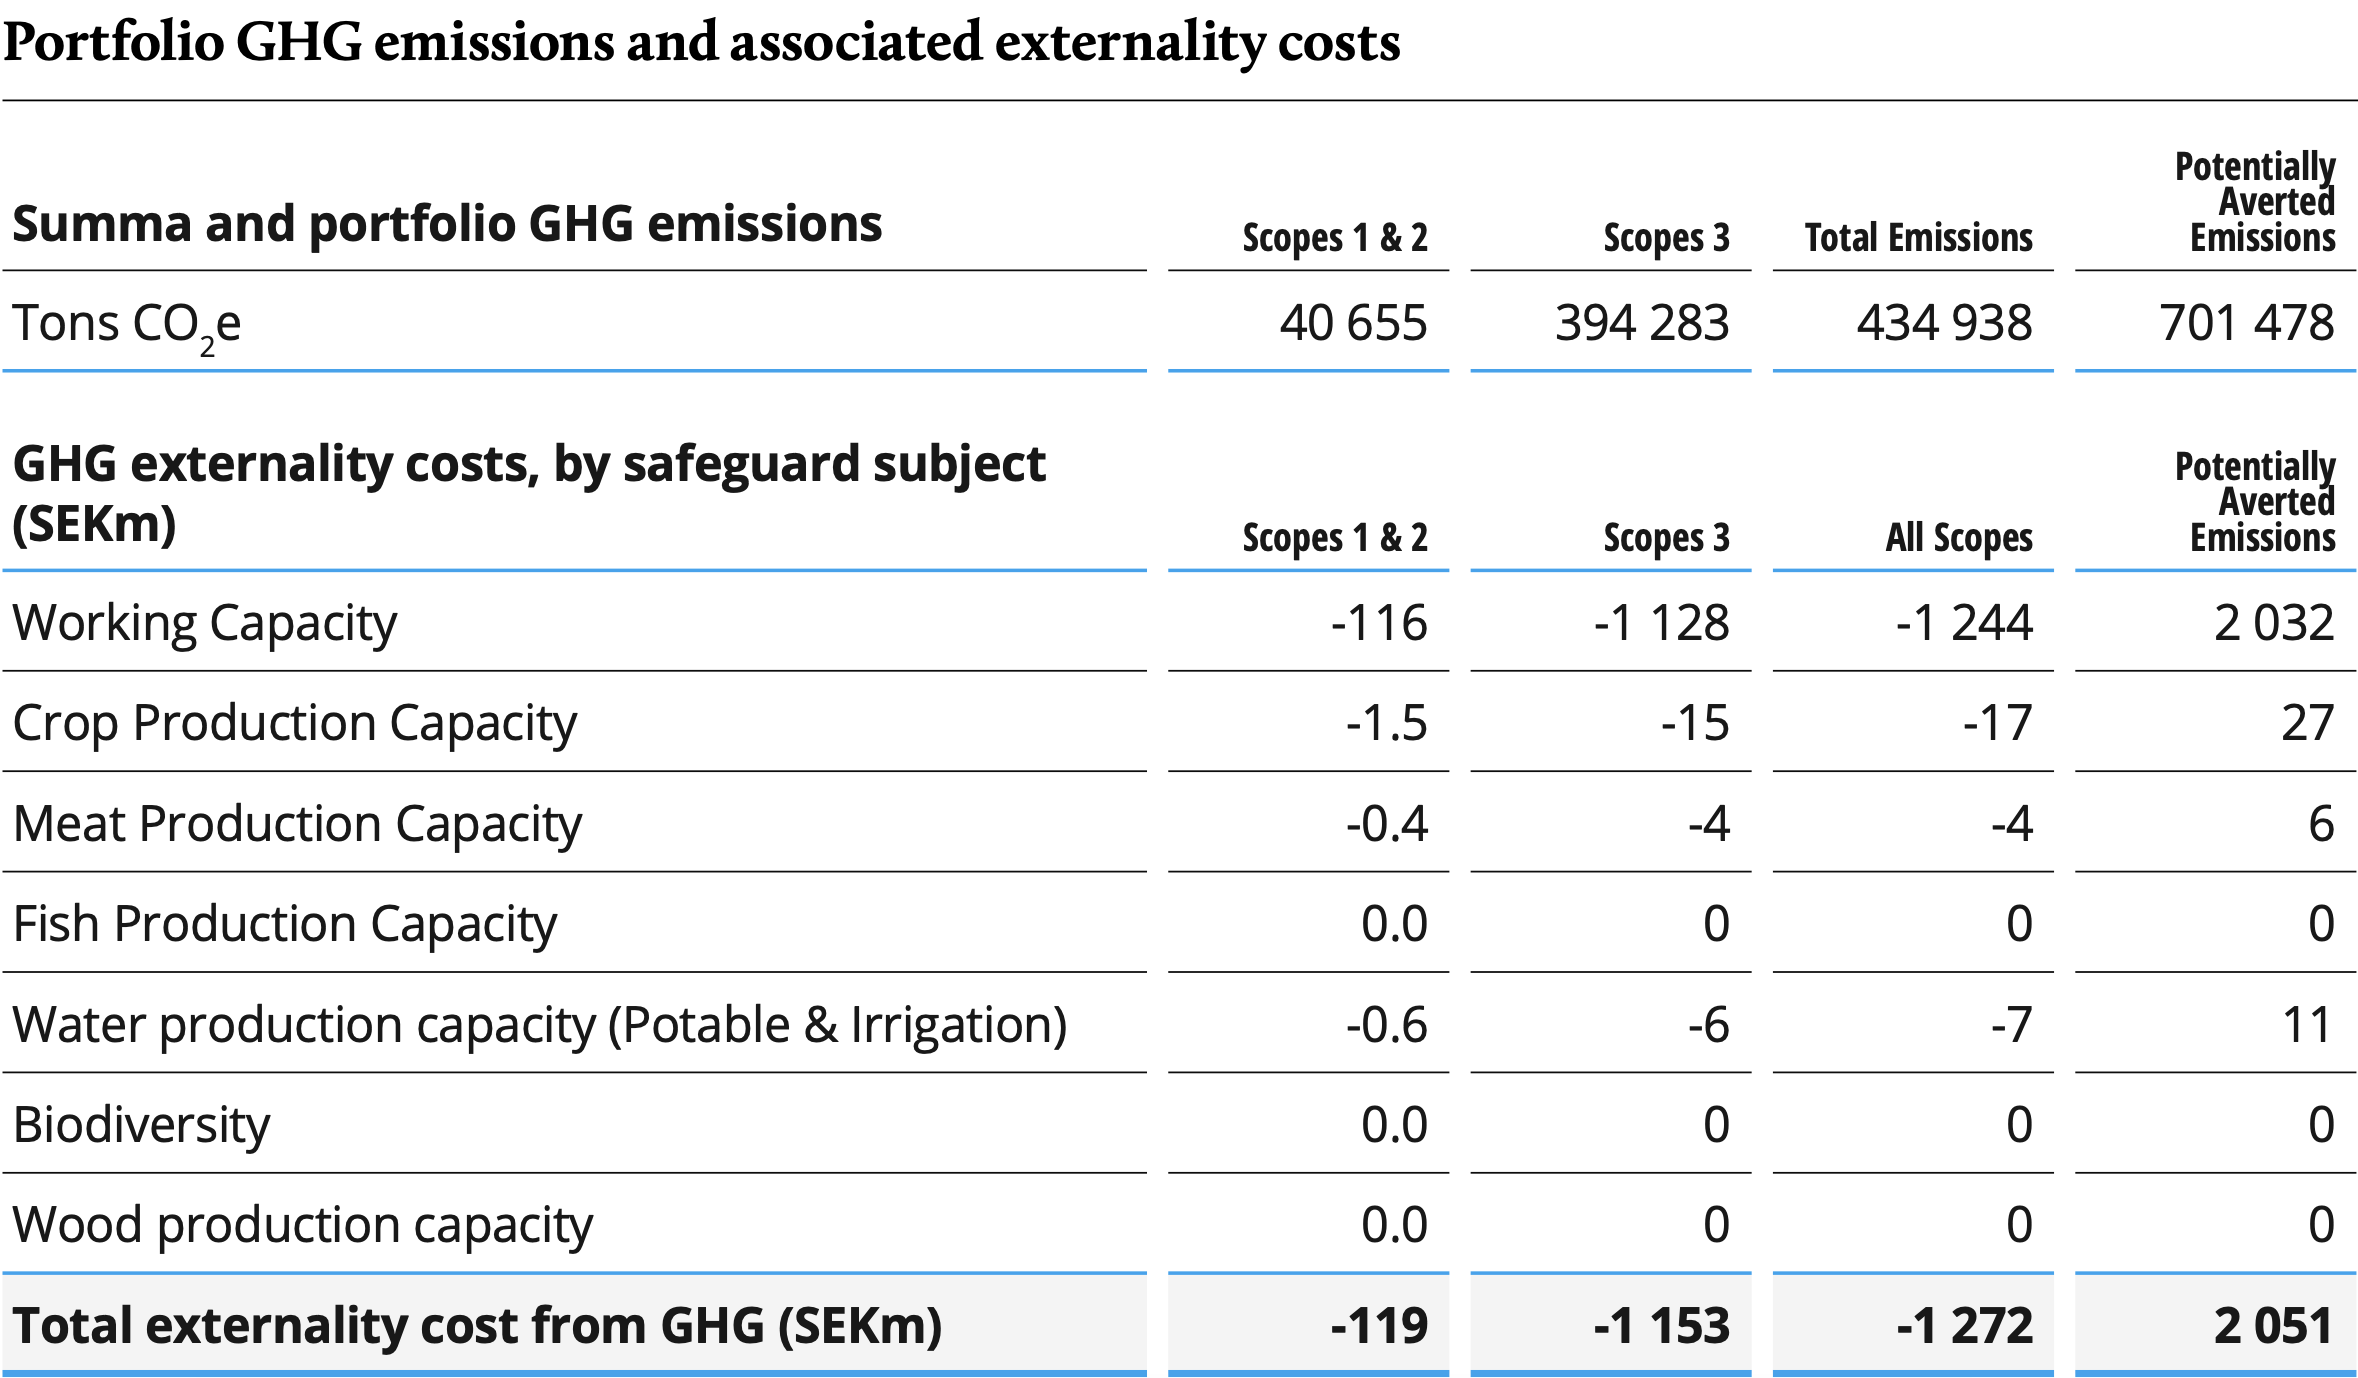
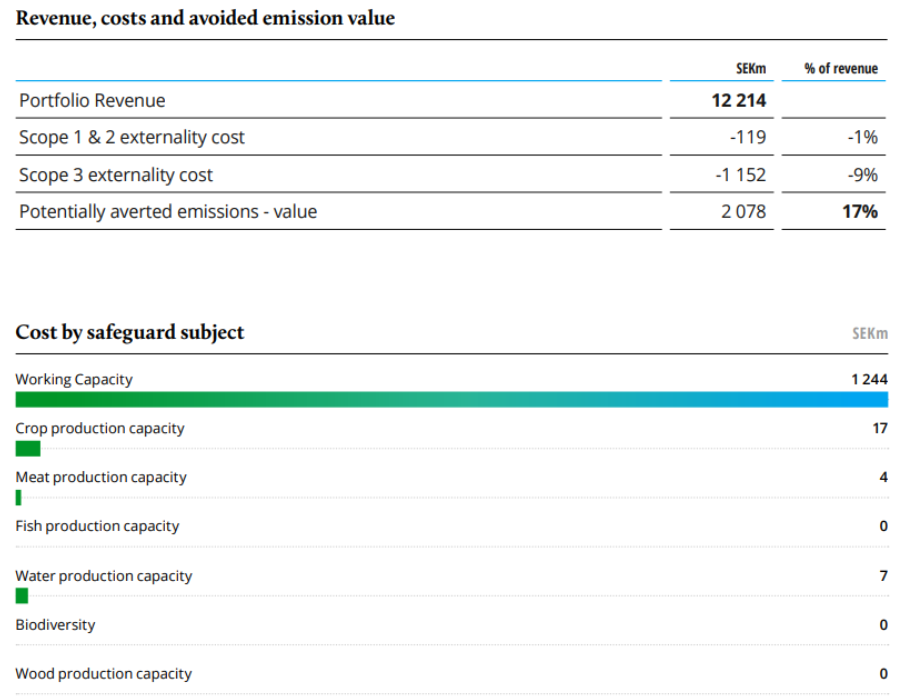
The table on the right shows the estimated costs of these externalities, broken down by emission scope and safeguard subjects. These figures are not calculated according to an accounting standard, and are unaudited. As they are based on recent research and are currently being trialed, they should be seen only as an illustration and a besteffort attempt to estimate the associated externality costs.
You can read more about Impact-Weighted Accounts and the safeguard subjects on page 15.

Portfolio biodiversity impact
Our Portfolio Report for 2018 introduced the tracking of negative externalities in terms impact on SDG 14: Life Below Water and SDG 15: Life on Land to complement the existing tracking of climate impact (SDG 13). This is important, as 75% of terrestrial environments and 66% of marine environments have been severely altered by human actions1.
While no Summa portfolio company currently has material direct impact on biodiversity sensitive areas, or IUCN red list species, value chains in waste management, food processing and water distribution do exhibit a substantial footprint.
As with our climate footprint, it will be necessary to explore avenues in which the ecological footprint may be reduced. Through our yearly assessment and engagement process, we strongly encourage our portfolio companies to explore how engagement with suppliers and industry peers may play a part in mitigating these adverse impacts over time.
Direct impact

Value chain impact

equivalent to...
Value chain non-GHG and GHG emissions, as well as other factors...

...lead to various types of harm to ecosystems
Ecotoxicity – Acidification – Nutrification – Eutrophication – Land occupation – Water Turbined – Water Drawdown – Climate change
- IPBES report 2019: https://www.unepfi.org/news/
themes/ecosystems/why-the-uns-latest-reporton-the-state-of-our-planets-biodiversity-andecosystems-matters-to-financial-institutions/ - Olink could not be included in the analysis due to recent IPO
Value chain impact 2020
In company and product footprints, ecological degradation and displacement is often measured in the unit PDF.m2.Year. This metric consists of three dimensions:
- PDF: Potentially disappeared fractions of species. This is a measure between 0 to 1 indicating the share of biodiversity displaced in a particular ecosystem
- m2: The number of square meters that have been affected by biodiversity loss
- Year: A measure of how long it would take for the affected species to regain the habitat
44.3 million PDF.m2.Year is similar to displacing 44.3 km2 worth of habitat for a year, which is about 6 202 soccer fields, or 23% of the area of Stockholm capital city. Four of Summa’s portfolio company value chains account for approximately 94% of our ecological footprint:
- Milarex: From upstream value chain of fish used as raw material for processing
- Norsk Gjenvinning & Sortera: From Production of heavy machinery, engineering services, waste treatment, upstream gas & chemicals use
- Lakers: Metals extraction and the manufacturing of parts and products used or sold by the company
As with our climate footprint, it will be necessary to explore avenues in which the ecological footprint may be reduced.
Removing carbon by protecting biodiversity
Ahueni
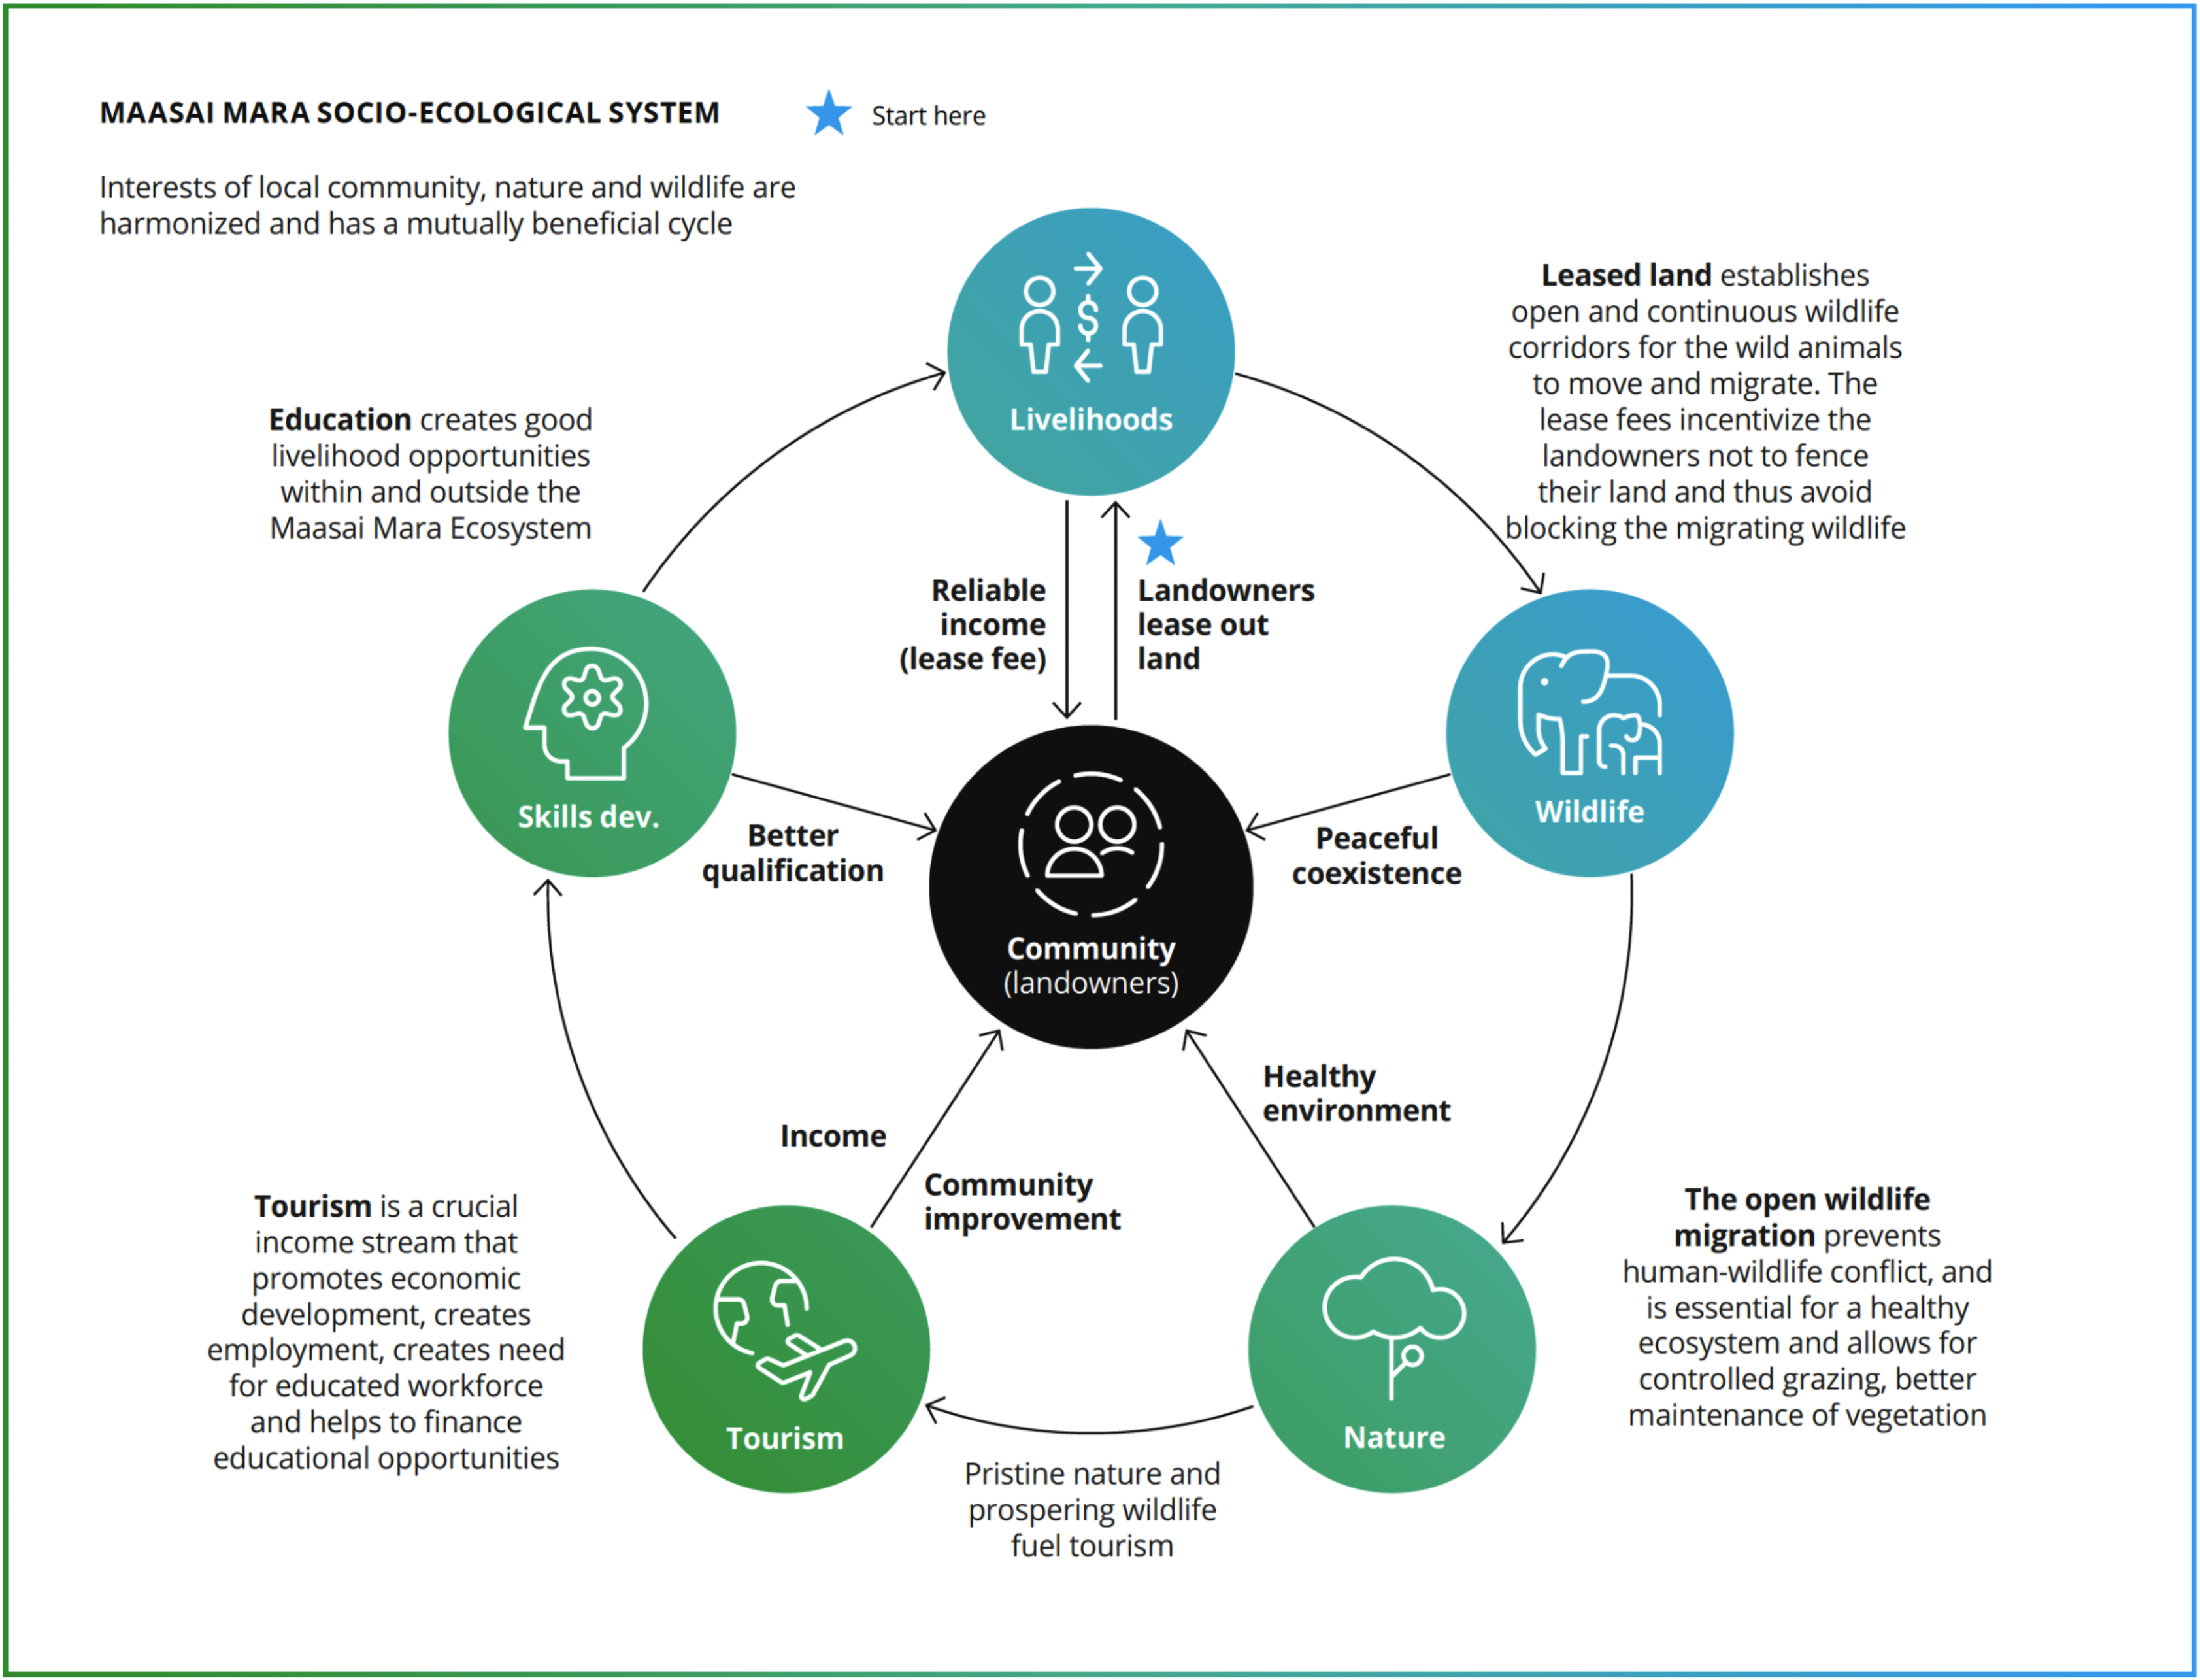
For several years, Summa has been a supporter of various community development projects such as wildlife conservation, local tree-planting and plastic recycling in Maasai Mara, Kenya. More recently, we have committed to the carbon credit development program Ahueni in the Greater Maasai Mara Ecosystem.
Tourism has been the main driver of the local economy in the Mara ecosystem, but relying on this alone leaves the economy vulnerable, as experienced during the latest Covid-19 pandemic.
Carbon credits represent an opportunity for the region to develop another source of income to ease the dependence on tourism alone as well as an opportunity to fund the restoration of degraded land. The program will take great care to
uphold best practices in terms of ecology and preservation of biodiversity. Summa has joined a group of four1 other international companies to form Ahueni, a Swiss/Kenyan not-for-profit company to develop the carbon credit program together with local landowner associations.
We have chosen this path to take a proactive role in fighting biodiversity loss and climate change, not simply reacting to external demands, but taking initiatives to accelerate progress. By active participation, Summa can contribute and ensure that the carbon credit program is of the highest quality. The Ahueni project targets restoration of a minimum of 60 000 hectares of land over the next 25 - 30 years.
Carbon credits are created through activities that either protect against future emissions or actively re-capture CO2 from the atmosphere to deposit carbon in its solid form. This is commonly done through various land-use activities such as increasing tree-covers, improving grassland management, or developing new technologies.
One carbon credit is defined as re-capture or emission avoidance of 1 metric ton of CO2 (tCO2e).
- 1 LGT Venture Philanthropy Foundation (LGT VP), Baggins AG, MV Capital AG and Weitblick GmbH
Enhancing resilience with portfolio-wide goals
One of the four core pillars of Via Summa, is to build resilience. To build a platform for sustainable growth, you need to understand your company’s material risks from an ESG as well as an operational and financial perspective.
In Summa we have identified common elements that are material at an overall portfolio level, to build resilience and enable long-term sustainable outperformance of the portfolio:
- Diverse leadership competences and perspectives to win in the future sustainable economy
- Climate conscious growth that supports environmental protection and reduces climate risks
- Responsible business practices across operations and supply chain
These three elements link to the common SDG KPIs that are reported in the sections on social and environmental impact, providing insight into the current portfolio position. We have set targets on each element to strengthen our portfolio resilience. Although these targets do not fully capture the breadth of these issues, we see them as an important step to strengthen common resilience elements with our portfolio companies. Our common SDG KPIs will be refined over time to better measure our progress.
We have started to formally leverage the Impact Management Project (IMP) five impact dimensions in the impact assessment of new investments.
We are also using the framework to improve transparency on the impact of our current portfolio companies, explaining the positive outcomes they create through five paragraphs modeled on the impact dimensions. We intend to work with our companies going forward to deepen the IMP assessment and assign the most relevant impact class for each company. Impact classes B – Benefit Stakeholders, and C – Contribute to Solutions are the impact classes that are relevant to Summa’s investment strategy. We see this as another tool for building resilience and investing in companies that are more future-proof.
Diverse leadership:
- Minimum 40% gender diversity in Summa Leadership Team (2020: 33%)
- Minimum one third (33%) gender diversity in the Summa Board and the Boards of our portfolio companies by 2022 (2020: 75% and 23% respectively)
- Each PortCo to set diversity and gender equality targets appropriate to each case
Climate conscious growth:
- 50% carbon intensity reduction in the Summa portfolio from 2020 to 2030
- All portfolio companies to implement climate strategies aligned with a 1.5˚C scenario
- Climate compensation of 100% of scope 1 and 2
Responsible business practices:
- Maintain 100% Via Summa Compliance in portfolio.
- Via Summa Compliance implemented for new portfolio companies within 6 months
- Task Force for Climate-related Financial Disclosures
Pricing externalities
Impact-Weighted Accounts pilot
In our recent collaboration with the Impact-Weighted Accounts Project1 at Harvard Business School, we looked at societal costs along the environmental pillar, using CO2-equivalent greenhouse gas emissions as the input. The methodology enables a cost analysis by affixing a price and financial value to a range of clearly defined harmful effects to nature and human health associated with these emissions.
What are Impact-Weighted Accounts?
Impact-weighted accounts (IWA) are line items on a financial statement, such as an income statement or a balance sheet, which are added to supplement the statement of financial health and performance. These additional line items are intended to help reflect a company’s positive and negative impacts on employees, customers, the environment, and the broader society.
The principles of IWA
- Impact can be measured and compared
- Impact should be measured within an accounting framework with the aim of harnessing our economy to improve our society and planet
- Transformational change requires that impact measurement be scalable
- To be scalable it needs to be actionable and cost-effective
Why monetize impact?
- It translates social and environmental impact into comparable units that business managers and investors intuitively understand.
- IWA be meaningfully aggregated and compared without obscuring important details needed for decision-making.
- Displays financial and impact performance in the same accounts, allowing for the use of existing financial and business analysis tools to assess corporate performance.
Pilot results
The results of the IWA pilot analysis show that the externalities associated with scope 1 & 2 emissions have a cost of about 1% of portfolio revenues. When factoring in the full value chain emissions, the total externality cost is about 10% of the aggregate portfolio income. These effects stem from impact on human health, crop production, and water availability, among other factors.
Conversely, about 701k tons of CO2e emissions were potentially avoided due to the provision of portfolio products and services in 2020. Applying the same methodology to potentially averted emissions yields a value of about SEK 2bn, or 17% of portfolio revenue.
We aim to use the IWA approach to monetize social and product impacts also in the future and explore ways in which impact-weighted accounts can be used as an additional tool to aid our understanding of the negative and positive impacts of our portfolio.
The societal cost of climate change
The below are a selection of safeguard subjects, which have been used to monetize impact in this pilot. The safeguard subjects refer to resources that are necessary to satisfy human needs. The availability of each is affected by GHG emissions through a number of mechanisms, as exemplified below.
Working capacity:
Effect on human value creation from work, through Years of Life Lost (YLL)
Meat production:
Food production is affected by climate change and sea level rise
Fish production:
Affected by ocean acidification
Water production:
Affected through climate change, by increased evaporation from waterways
Biodiversity & Wood production:
Forests and other ecosystems/habitats affected due to climate change and other effects
The principles of IWA
- Impact can be measured and compared
- Impact should be measured within an accounting framework with the aim of harnessing our economy to improve our society and planet
- Transformational change requires that impact measurement be scalable
- To be scalable it needs to be actionable and cost-effective
Why monetize impact?
- It translates social and environmental impact into comparable units that business managers and investors intuitively understand.
- IWA be meaningfully aggregated and compared without obscuring important details needed for decision-making.
- Displays financial and impact performance in the same accounts, allowing for the use of existing financial and business analysis tools to assess corporate performance.
- Affiliated with the Impact-Weighted Accounts Initiative (IWAI)
Normative pilot
Normative, our ESG analytics provider, conducted an environmental cost analysis, using the sectors of our 2019 portfolio companies.
The methodology combined Input-Output analysis of emissions with a willingness to pay approach to impact monetization.
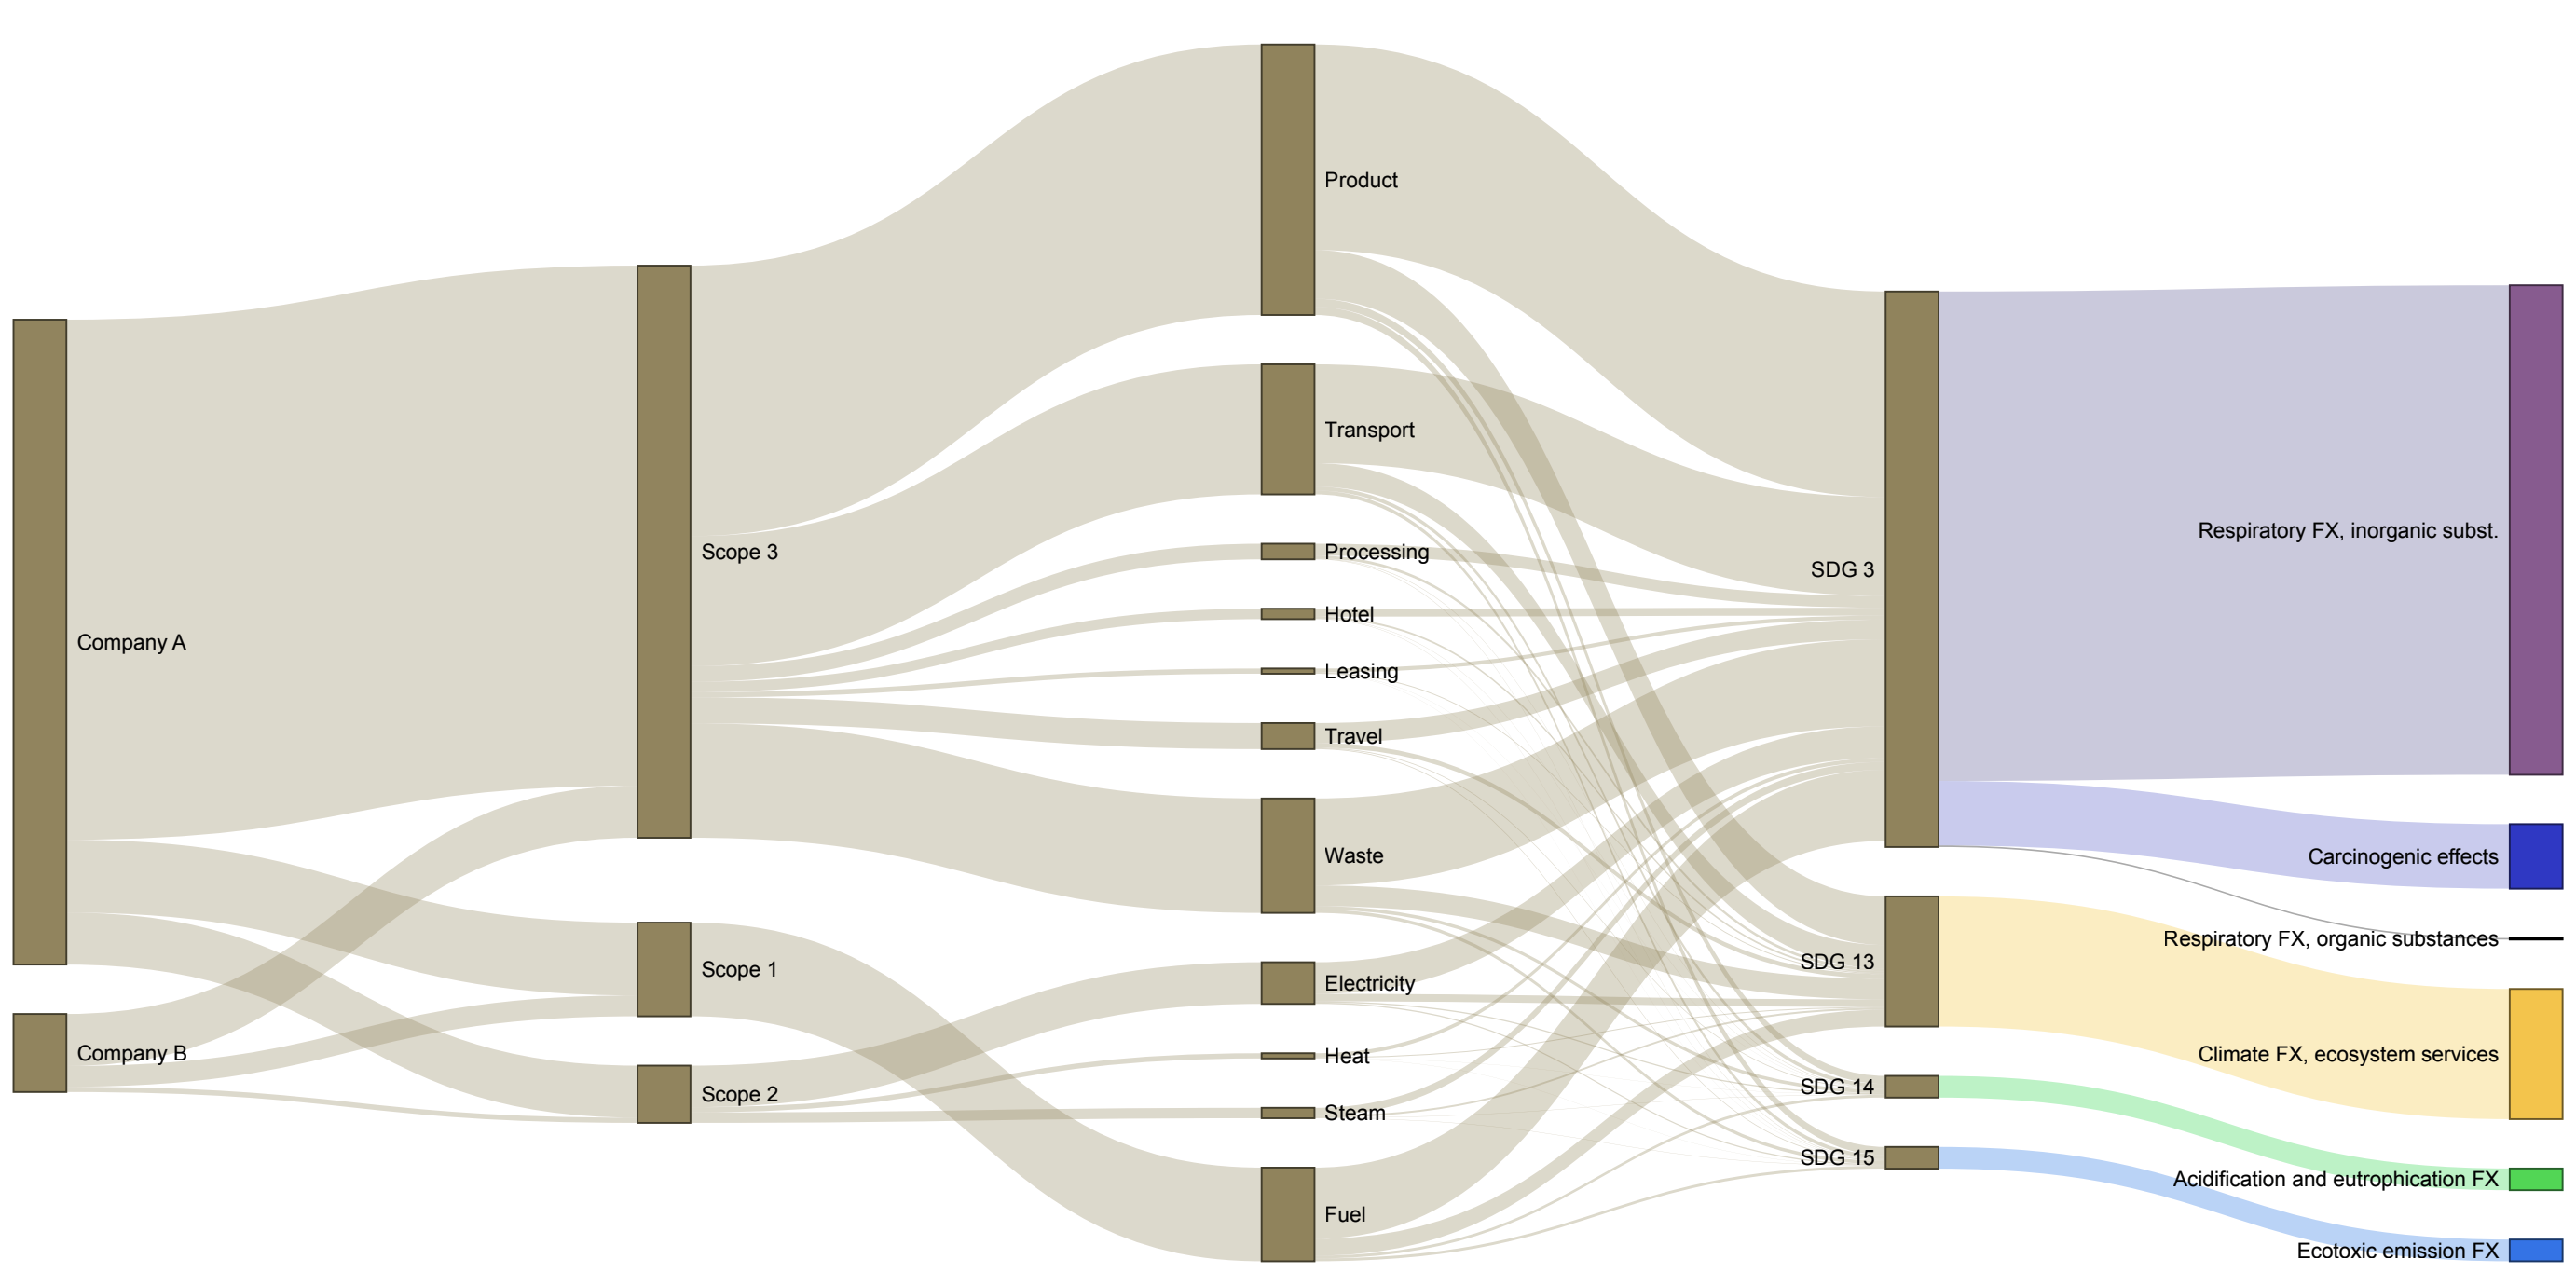
The simplified illustration below does not contain the actual results but illustrates some of the insights provided by the analysis. For example, the impact drivers are broken down by economic activities, as well as each company's Scopes 1, 2, 3. The impacts from each activity are then further broken down in terms of the affected SDGs, and subsequently the particular harmful effects that drive this impact.
Portfolio externalities were modeled in the following steps:
Input-output modeling: the supply chain of each company was modeled with the help of multi-regional inputoutput analysis Stadler, Konstantin, et al.1 This input-output model contains the materials, chemical, and emissions output required to produce EUR 1m of goods and services to a final consumer.
Impact characterization: the impact of each material and chemical flow was assessed using an ensemble of characterization factors, mainly from Schmidt, J. H., et al2, assessing how the material/chemical flows affects ecosystem quality and human health, through pathways such as carcinogenic substances, respiratory illness, radiation, climate change, acidification and eutrophication.
Monetization: the human health and ecosystem quality was monetized using willingness to pay figures and budget constraint extrapolations from Weidema, B., M. et al3.
Risk normalization: the total risk is measured as, how much externalities (EUR) would be created from spending EUR 1 on Summa's portfolio. Alternatively, how large are externalities as % of what you spend. The results from this approach showed that the costs of externalities to a large extent are concentrated in human health impacts.
Good Health and Well Being
Externalities in portfolio
- Schmidt, J. H., et al. "CREEA report: Recommendation of terminology, classification, framework of waste accounts and MFA, and data collection guideline." (2012).
- Stadler, Konstantin, et al. "EXIOBASE 3: Developing a time series of detailed environmentally extended multi-regional input-output tables." Journal of Industrial Ecology 22.3 (2018): 502-515.
- Weidema, B., M. Hauschild, and O. Jolliet. "Stepwise 2006–a new environmental impact assessment method." International Journal of Life Cycle Assessment (In prep.). Ecomed Publishers, Landsberg (2007).
Further reading: George, et al. "Corporate Environmental Impact: Measurement, Data and Information." Harvard Business School Accounting & Management Unit Working Paper 20-098 (2020). Weidema, Bo P. "The social footprint—a practical approach to comprehensive and consistent social LCA." The International Journal of Life Cycle Assessment 23.3 (2018): 700-709.
Fund timeline
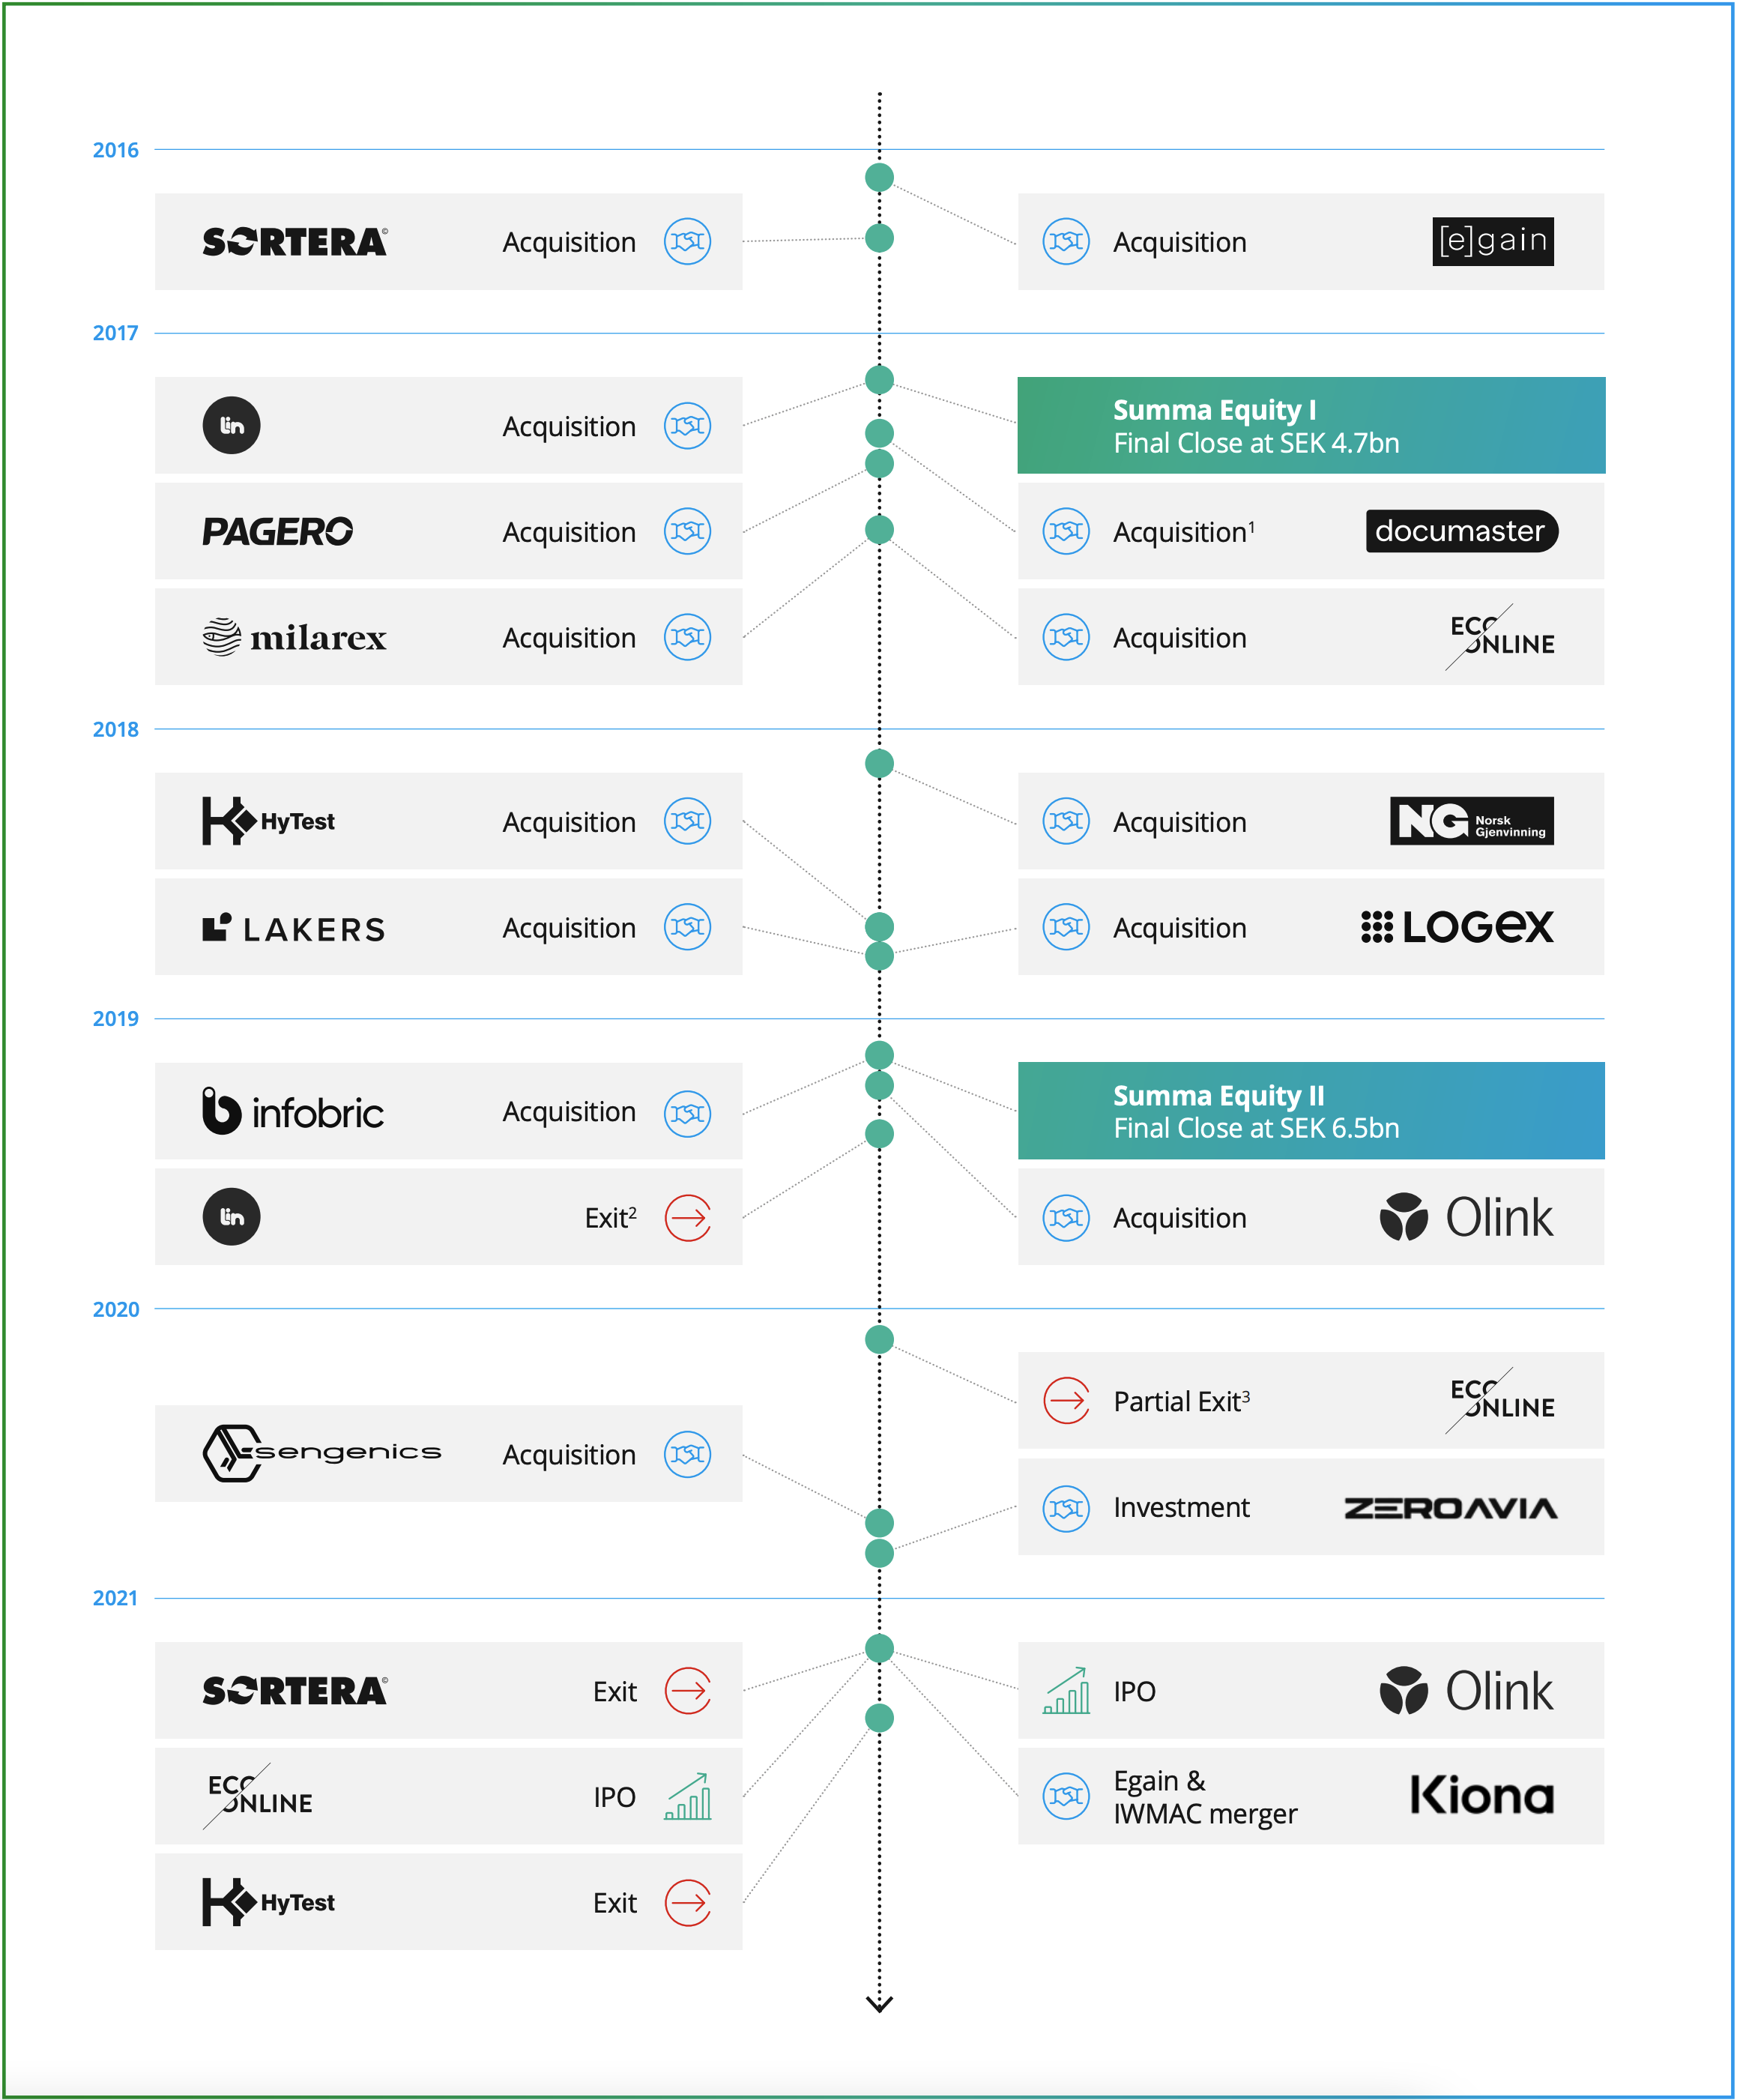
- Documaster was previously part of Summa Digital HB in addition to the UK people analytics company Qlearsite Limited. Summa exited Qlearsite in September 2019, leaving Documaster as the remaining growth equity investment in Summa Equity Fund I.
- Legal separation and partial sale of Lin’s hardware business (majority of Lin’s total business) was completed on 23 May 2019. The remaining software business, Loops Education, was subsequentially exited in March 2020
- EcoOnline secured new capital from Summa Equity Fund II and Goldman Sachs Merchant Banking Division to support the next value creation phase. The deal yielded a partial exit for Summa Equity Fund I, and Summa Equity Fund II will remain invested

